
Using Air Quality Data
Why are there some days when air pollution levels are high, and some days when it is low?
As air pollution is often measured continuously, it is easy to see variations in the levels. Air pollution can change from one hour to the next, and from day to day. Levels of air pollution can also vary depending on the time of year.
The reasons for this variability in air pollution levels are:
- The sources of pollution emit at different times
- Some sources only produce emissions at specific times
- Weather conditions affecting how air pollution disperses
- Pollution blowing in from far away
1. The sources of pollution emit at different times
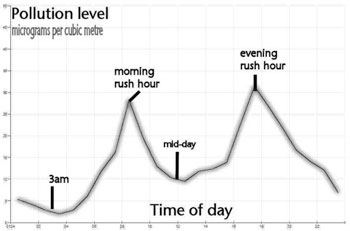 If you think of a busy road carrying lots of traffic into the city centre, this will generally be very busy during the morning and evening rush hour. If an automatic pollution monitor was sited near the road, it would detect higher pollution levels during these times. The graph produced from the analyser could look like this.
The horizontal axis shows time, the vertical axis shows levels of pollution. During the middle of the night air pollution levels are low, as there are hardly any vehicles travelling along the road.
2. Some sources only produce emissions at specific times
In early November, in the UK, a specific celebration causes air pollution to increase. What do you think this is and why does air pollution get worse?
3. Weather conditions affecting how air pollution disperses
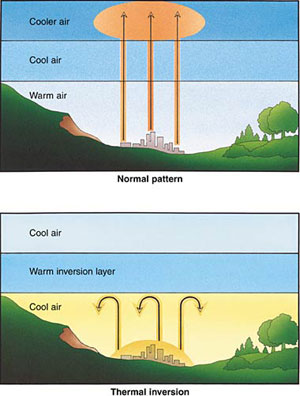 In winter, a weather phenomenon known as a temperature inversion may occur. In normal conditions the higher you go up from the ground the colder the air gets. This is why for example some high mountains can keep snow on their peaks in summer.
The effect of a temperature inversion is to trap cold air at a lower altitude than normal. So inverting, or turning upside down, what we usually experience – i.e. warmer air at lower altitudes. Trapped in this cold air is pollution that would normally be dispersed. Temperature inversions are usually short lived and may last only a few hours. However, when one lasts for several days and is over an urban area, pollution can build up to very unhealthy levels.
4. Pollution blowing in from far away
Every so often in the UK, we experience air pollution episodes, which are caused by pollutants originating from abroad. A common example is when certain weather conditions cause sand from as far away as the Sahara desert in Africa, to be carried by the wind and deposited on the UK.

Sometimes we can see this as dust that appears on cars and windowsills. Another example is when a volcano erupts and sends ash high into the atmosphere that can then be spread around the world by global wind patterns.
Why does air pollution change from location to location?
In towns and cities, the largest source of air pollution is from road traffic. Motorways are the largest roads with the most traffic. Most of the time, motorways cut through the countryside and are away from where people live and work. If we were to place, a nitrogen dioxide monitor 50 metres away from a motorway, in a rural area where there were no other roads, motorway junctions, industry or houses, we would get lower levels than if the same piece of equipment was sited within 50 metres of a motorway that was congested, had other roads, industry and homes nearby. So air pollution is highest where there is most activity that results in pollution being produced.
Even within towns and cities, air pollution can vary within a few hundred metres from the source. For example, nitrogen dioxide from exhausts of vehicles traveling on a busy and congested road, can cause pollution levels to be high close to the road edge. In some areas, houses that have no or small front gardens are very close to the road. If a diffusion tube was placed on the front of the house to measure nitrogen dioxide, higher concentration would be found here than if a diffusion tube was placed at the bottom of the back garden away from the road. There is a very quick reduction in nitrogen dioxide pollution levels from the road, especially if there are no other sources nearby.
In rural areas, especially those that are downwind of cities, ozone pollution can be found at higher levels than in urban areas. Ozone forms on days when it is warm, still and sunny, through chemical reactions that are powered by sunlight reacting on other pollutants found in, for example, road traffic exhausts. This can get carried on the wind, away from cities during calm, warm and sunny days in the summer months. This can result in some parts of the countryside being more polluted than the city. A fact that surprises many people!
Activity 1 – Checking that Government targets are being met
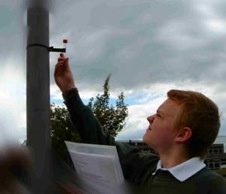
The table below shows a list of sites in Sheffield where diffusion tubes have been located to measure nitrogen dioxide. The diffusion tubes are attached to lamp posts and road signs.
You will notice that sometimes, the data from each tube is not available due to either the tube being vandalised, blown away in strong winds or the stopper at the end of the tube not being removed.
Other times the data appears inaccurate due to a large source of pollution being temporarily sited near the tube, for example during road works or a construction site. Excessive dust can also contaminate the inside of the tube making it impossible to analyse.
Each tube has been left outdoors to collect a sample of the nitrogen dioxide in the air for one month at a time. The mean for the year is then calculated from these results and is used by Sheffield City Council to see if the site is within the UK Government’s air quality target for nitrogen dioxide of an average of 40 micrograms per cubic metre of air for any single year.
To do:
- Work out the mean for each site for the year?
- Suggest why there is a range of averages?
- Suggest why the tube sited at Scotland Street has a high reading in September and explain why this reading should be treated as an outlier and not used when calculating the mean reading for Scotland Street?
- Suggest why some of the tubes have “no data”, “missing” or “tube not properly exposed” in the table?
- Find out which sites are above the Government target for the year?
| Site | Jan | Feb | Mar | April | May | Jun | Jul | Aug | Sep | Oct | Nov | Dec |
|---|---|---|---|---|---|---|---|---|---|---|---|---|
| Barnsley Rd | 36 | 48 | 49 | 51 | 47 | 59 | 43 | 42 | 42 | 53 | 48 | 51 |
| Upwell Street | 33 | 39 | 45 | 53 | 46 | 57 | 36 | 39 | No data | 63 | No data | 52 |
| Burngreave Road | 35 | 46 | 38 | 42 | 41 | 41 | 41 | 37 | 38 | 50 | 51 | 28 |
| Exchange Street | 41 | 56 | 42 | 45 | 42 | 46 | 44 | 45 | 43 | 54 | 47 | 49 |
| Duke Street | 49 | 54 | 52 | 54 | 51 | 52 | 51 | 51 | 52 | 59 | 58 | 62 |
| Waingate | 46 | 55 | 52 | 64 | 51 | 60 | 41 | 51 | 41 | 64 | 54 | 59 |
| Fitzalan Square | 46 | 60 | 59 | 59 | 54 | 63 | 55 | 55 | No data | 6 | 68 | 68 |
| Barkers Pool | 26 | 38 | 35 | 33 | No data | 31 | 29 | 25 | No data | 44 | Tube not properly exposed | 38 |
| Scotland Street | 24 | 33 | 22 | 28 | 27 | 28 | 26 | 25 | 572 | 38 | 33 | 35 |
Nitrogen dioxide results from diffusion tubes – Sheffield 2007, shown in micrograms per cubic metre of air (µg m-3)
Activity 2 – Comparing air pollution levels at different places
Sometimes two or three diffusion tubes are placed close to each other at a particular site. This is done to check the accuracy of the results, and is normally done at a site where there is also an automatic continuous monitor.
Usually the tubes will give slightly different results. This could be for one or more of the following reasons:
- there were slight variations in how air circulated around the tubes
- the tubes are not exactly identical, or may have become contaminated
- the tubes were not used and analysed in exactly the same way
The spread of measurements must be taken into account when comparing the mean to the mean at another site.
Three diffusion tubes were left at each of four different sites. The tubes were then analysed giving the concentrations of nitrogen dioxide (in micrograms per cubic metre of air) shown in the tables.
| Site | Tube 1 | Tube 2 | Tube 3 | Mean | Range |
|---|---|---|---|---|---|
| Afro – Caribbean Enterprise Centre (ACE1) | 30 | 29 | 31 | ||
| Afro – Caribbean Enterprise Centre (ACE2) | 26 | 33 | 29 | ||
| City Centre | 37 | 33 | 31 | ||
| Tinsley | 42 | 40 | 38 |
To do
- For each site calculate the mean value and make a note of the range (lowest to highest value).
The mean is the best estimate of the true value. But, because of the spread of the results, there is still a chance that the true value is somewhere between the lowest and highest value in the repeated measurements. So if the ranges for two means overlap, you cannot be confident that there is a real difference between the means.
- Compare the means and ranges for the ACE and ACE 2 sites. Are you confident that the difference in nitrogen dioxide levels at the two sites is real?
- Compare the means and ranges for City Centre and Tinsley sites. Are you confident that the difference in nitrogen dioxide levels at the two sites is real?